Comm Eye Health Vol. 30 No. 100 2018 pp 88-89. Published online 07 February 2018.

Cataract surgical rates

Related content

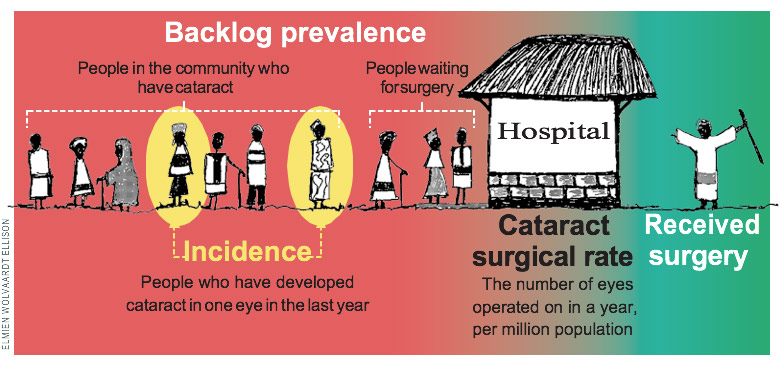
Figure 1 – Understanding incidence, backlog and cataract surgical rate

Screen Shot 2018-01-25 at 17.58.01

Cataract remains the largest cause of blindness worldwide. Cataract surgical rate, or CSR, measures how many cataract operations are performed per million population in a given year. The map shows the latest available data taken from the IAPB atlas.

Cataract may cause moderate vision impairment (<6/18 to 6/60), severe vision impairment, (<6/30 to 3/60) or blindness (<3/60). People may have bilateral or unilateral cataract, so it is more useful to consider the number of eyes than the number of people who require surgery. Cataract surgical rate (CSR) is the number of cataract operations performed in one year, per million population. It is a measure of the quantity of cataract services.

CSR needed in each country (the target CSR) is determined by the number of eyes that will develop cataract in one year (the incidence).

Incidence is affected by the age structure of a population. Older populations have a higher incidence of cataract than younger populations.

If the number of new cases (the incidence) is higher than the cataract surgical rate, then the backlog (the number of eyes that require cataract surgery), will also be high.

High Income

Country CSR Year
United States 6,353 2010
Australia 7,202 2014
Japan 10,198 2013
Malta 11,085 2015

Latin America & Caribbean

Country CSR Year
Jamaica 264 2013
Antigua & Barbuda 370 2013
Haiti 542 2013
Bolivia 586 2013
Belize 639 2013
Honduras 723 2013
Guatemala 781 2013
Ecuador 972 2013
Peru 1,143 2013
Grenada 1,214 2012
Bahamas 1,332 2013
St Kitts & Nevis 1,454 2013
Mexico 1,475 2013
Paraguay 1,538 2013
Panama 1,563 2013
Nicaragua 1,749 2013
Colombia 2,005 2013
El Salvador 2,015 2013
Venezuela 2,027 2013
St Vincent & Gren. 2,131 2013
Uruguay 2,161 2013
Dominican Rep. 2,167 2013
Guyana 2,413 2013
Chile 2,434 2013
Saint Lucia 2,455 2013
Costa Rica 2,950 2013
Cuba 3,115 2013
Brazil 3,165 2013
Barbados 5,647 2013
Argentina 6,748 2013
Suriname 8,202 2013

Central Europe, Eastern Europe & Central Asia

Country CSR Year
Moldova 977 2014
Romania 1,361 2009
Serbia 2,478 2009
Bulgaria 4,616 2009
Lithuania 4,670 2009
Latvia 5,673 2009
Czechia 7,800 2009
Hungary 8.372 2014

North Africa & Middle East

Country CSR Year
Afghanistan 717 2014
Oman 969 2014
Saudi Arabia 1,187 2014
Kuwait 1,462 2014
Sudan 2,121 2014
Egypt 2,761 2014
Pakistan 2,819 2014
Morocco 2,924 2014

Sub-Saharan Africa

Country CSR Year
Cote D’Ivoire 150 2014
DR Congo 157 2010
Liberia 157 2014
Uganda 192 2010
South Sudan 240 2010
Burundi 247 2014
Nigeria 317 2015
Mozambique 333 2015
Madagascar 368 2014
Sierra Leone 409 2015
Togo 429 2014
Ethiopia 434 2010
Senegal 472 2014
Rwanda 483 2015
Kenya 494 2014
Tanzania 518 2010
Malawi 523 2010
Guinea 535 2014
Benin 578 2014
Zimbabwe 631 2014
Cameroon 686 2014
Zambia 690 2014
Niger 708 2014
Ghana 710 2014
Mali 807 2015
South Africa 847 2015
Lesotho 937 2014
Botswana 1,490 2015
Mauritius 4,604 2016

South Asia

Country CSR Year
Bangladesh 1,193 2014
Maldives 1,441 2014
Bhutan 1,553 2015
Myanmar 1,978 2015
Nepal 4,364 2015
India 4,830 2014
Sri Lanka 5,386 2015

South-East Asia, East Asia & Oceania

Sub-Saharan Africa

Country CSR Year
Papua New Guinea 196 2014
Micronesia 531 2014
Timor-Leste 784 2014
Laos 888 2014
Mongolia 1,068 2014
Malaysia 1,397 2014
China 1,402 2015
Indonesia 1,411 2014
Philippines 1,485 2014
Solomon Islands 1,601 2012
Cambodia 1,844 2015
Kiribati 2,185 2014
Vietnam 2,435 2014
Singapore 2,627 2014
Thailand 3,102 2015
Lady removing eye bandage from a smiling female patient after cataract surgery
A woman sees for the first time after cataract surgery. TANZANIA © Suzanne Porter/ Sightsavers